Basic, Free
Core Error Logs capture for 1 site, with PHP errors and fatal crashes surfaced in-app out of the box.

Error Logs collects PHP errors, warnings, and fatal errors from your site into one readable view in the WP Tailwatch app and dashboard. Spot a failing plugin, trace a white-screen crash, and debug fast, no SSH or FTP required.
Error Logs is a WP Tailwatch feature that captures PHP errors, warnings, fatal errors, and site errors into one readable view in the app and dashboard. Instead of hunting through raw log files over SSH or FTP, you can spot a failing plugin or theme and debug white-screen issues in seconds.
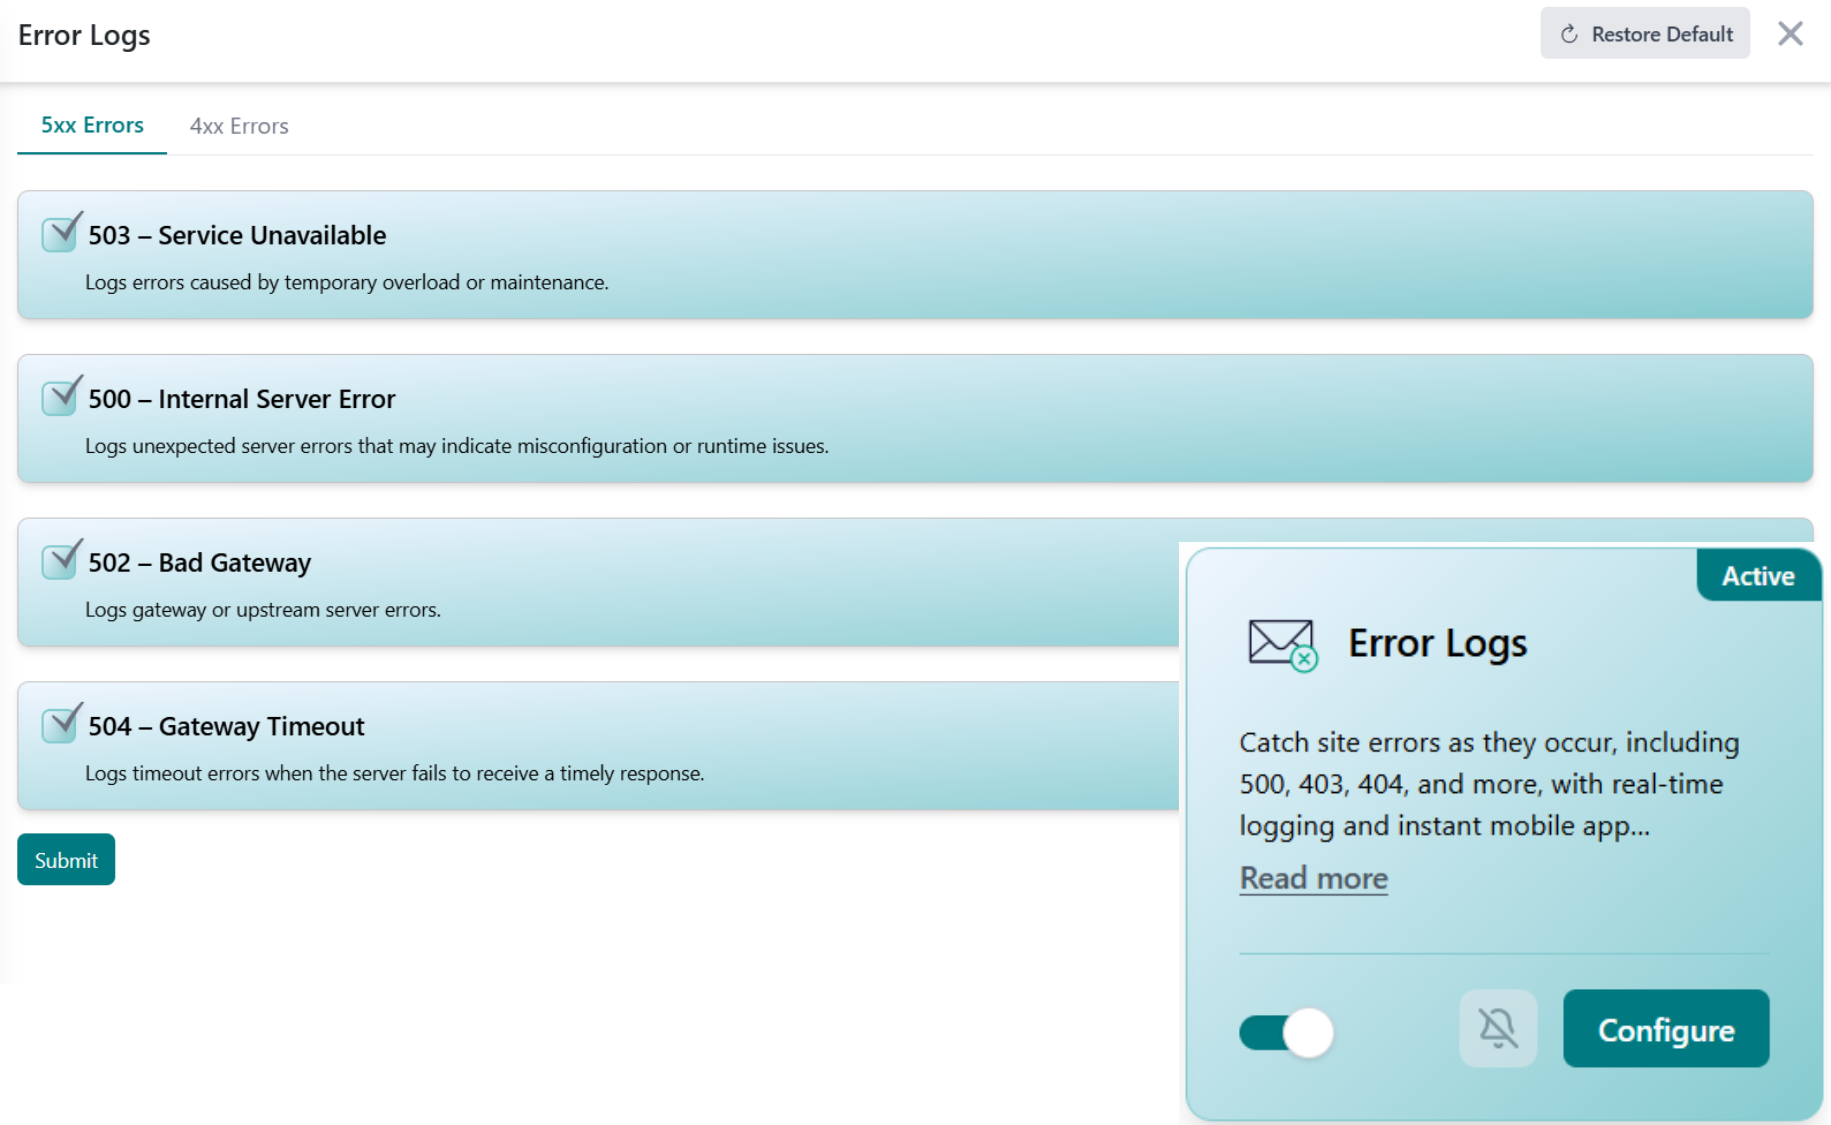
When a WordPress page breaks, the answer is usually buried in a server log you can't easily reach. Error Logs pulls those PHP errors, warnings, and fatal crashes into a clean view so you can find the cause without ever opening a terminal.
Capture errors as your site runs, read them in one clean list, and trace each fatal crash back to the plugin or theme behind it. All from your phone, without touching the server.
WP Tailwatch collects PHP errors, warnings, and fatal errors as your site runs, gathering them from the underlying error log automatically.
Each error appears in one readable list in the app and dashboard, complete with the message, file, and line, no SSH session or FTP client required.
Trace a recurring fatal error back to the plugin or theme that triggered it, then update, replace, or deactivate it to bring the page back.
WordPress runs roughly 43% of all websites, and every one of them is built on PHP, which means a single incompatible plugin, deprecated function, or theme conflict can throw a fatal error and take a page down. Source: W3Techs CMS usage statistics. When that happens, the difference between minutes and hours of downtime is whether you can read the error.
Error Logs removes the friction. Instead of requesting SSH access or FTP-ing into the server to grep through a raw log file, you open the WP Tailwatch app and see exactly what broke and where. That's the WP Tailwatch approach: the answers you need to fix your site, available from your phone.
Start reading your errors for free, scale up across every site you manage.
Core Error Logs capture for 1 site, with PHP errors and fatal crashes surfaced in-app out of the box.
Extended error history, detailed views, and faster debugging for 1-20 sites, paired with the full WP Tailwatch security suite.
Error monitoring across 21-1,000 sites with tiered volume pricing and one dashboard for your whole portfolio.
Error Logs pairs with the rest of WP Tailwatch, replacing 23+ separate plugins with one platform.
Error Logs captures PHP errors, warnings, fatal errors, and site errors from your WordPress install and presents them in one readable view inside the WP Tailwatch app and dashboard. You can review what's breaking without digging through raw log files on the server.
No. Error Logs surfaces your PHP and site errors directly in the WP Tailwatch app and dashboard, so you never have to open an SSH session or FTP into the server just to find out what went wrong.
Yes. A white screen is usually caused by a fatal PHP error from a plugin or theme. Error Logs captures that fatal error with its file and line, so you can identify the culprit and fix or deactivate it quickly.
Error Logs collects PHP fatal errors, warnings, notices, and general site errors. That covers the most common causes of broken pages, incompatible plugins, deprecated code, memory limits, and theme conflicts, mobile-first readable list.
Yes. Error Logs is fully available now as part of WP Tailwatch, there is no waitlist or beta. Core error capture is included on the free Basic plan, with full controls on the Business and Agency plans.
A standalone error log plugin only shows you errors. Error Logs is one of 23+ tools in WP Tailwatch, so you replace a single-purpose plugin and dozens of others with one platform that also handles security, monitoring, backups, and malware removal.
Yes. Because each captured error includes the file path where it originated, you can usually trace a recurring error straight back to the offending plugin or theme and decide whether to update, replace, or remove it.
Yes. From the WP Tailwatch mobile app and cloud dashboard you can review error logs for every site you own in one place, which is ideal for agencies keeping an eye on the health of many WordPress installs.
Capture every PHP error, read it in-app without SSH or FTP, and trace the failing plugin in seconds. Start free today.